

Scalable Profitability Insights
A rapidly expanding national franchise in the gourmet dessert space partnered with Analytic Vizion to address growing complexity around store-level profitability analysis.
With hundreds of locations and a fast-paced expansion model, leadership needed a way to compare stores contextually, understand market cannibalization, and deliver insights to both executives and field teams.
Analytic Vizion delivered a scalable solution powered by Snowflake, Tableau, and Python—consolidating data workflows, enabling accurate store benchmarking, and drastically reducing time-to-insight.
Reduction in Time-to-Insight
Increase in Field Team Engagement
Accuracy in Store Comparison Model

The Challenge
As a national franchise experienced rapid expansion, its leadership team faced a growing need for clarity around store-level profitability. With hundreds of locations opening across a wide range of markets, from dense urban centers to smaller regional areas, it became increasingly difficult to assess performance in a consistent and strategic way.
The organization needed to answer high-stakes questions:
- Which stores are truly profitable, and how do they compare in context?
- Are newly opened locations negatively impacting nearby stores?
- How can insights be scaled to support both executive strategy and local operational coaching?
Existing tools and processes lacked the flexibility to compare stores fairly or provide the level of granularity needed by both leadership and franchise support teams.
Without a standardized way to analyze performance, decision-makers risked misinterpreting results, missing opportunities, and slowing growth.

Our Approach
Analytic Vizion partnered with the franchise’s Office of the COO to build an integrated analytics solution for leaders and franchise success coaches.
Strategic Engagement & Discovery
Weekly check-ins kept stakeholders aligned as priorities evolved and enabled fast feedback throughout the engagement. The team used the “Mountain of Tomorrow” framework to clarify the business decisions the solution needed to support, including:
- Fair store-to-store profitability comparisons
- Regional growth and performance trends
- Same-store sales tracking
- Market saturation and cannibalization risk
Milestone-Driven Delivery
The work moved through structured, feedback-led phases:
- Established data access, permissions, documentation, and source-system context.
- Explored and validated historical data, key metrics, and stakeholder expectations.
- Built a comparability model that grouped stores by factors such as location, size, and demographics.
- Designed, tested, and refined Tableau dashboards with stakeholder input.
- Delivered the solution and enabled both executive and field teams to use it.
Tools & Technologies Used
- Snowflake: Served as the backbone for centralized data access and secure, scalable SQL queries
- Tableau: Used to build high-impact dashboards that translated complex metrics into intuitive visual stories
- Jupyter Notebooks
- Python: Enabled fast prototyping and ad hoc analysis during exploratory phases


The How
Behind the scenes, this success was driven by a blend of technical skill, flexible process design, and a strong focus on human alignment. Analytic Vizion’s model emphasized:
- People: Weekly alignment meetings, stakeholder engagement from kickoff to QA, and trust-building through transparency
- Process: A milestone-based project plan that allowed for quick pivots and built-in QA at every step
- Technology: Seamless integration of Snowflake, Tableau, and Python tools to automate the workflow and speed up delivery
The final deliverable was not just a set of dashboards—it was a system of insight designed to evolve with the franchise, inform both growth strategy and field support, and serve multiple audiences through one cohesive solution.
The Results
The engagement produced a powerful suite of outcomes, transforming how the franchise understood and acted on performance data:
Custom Store Comparability Model
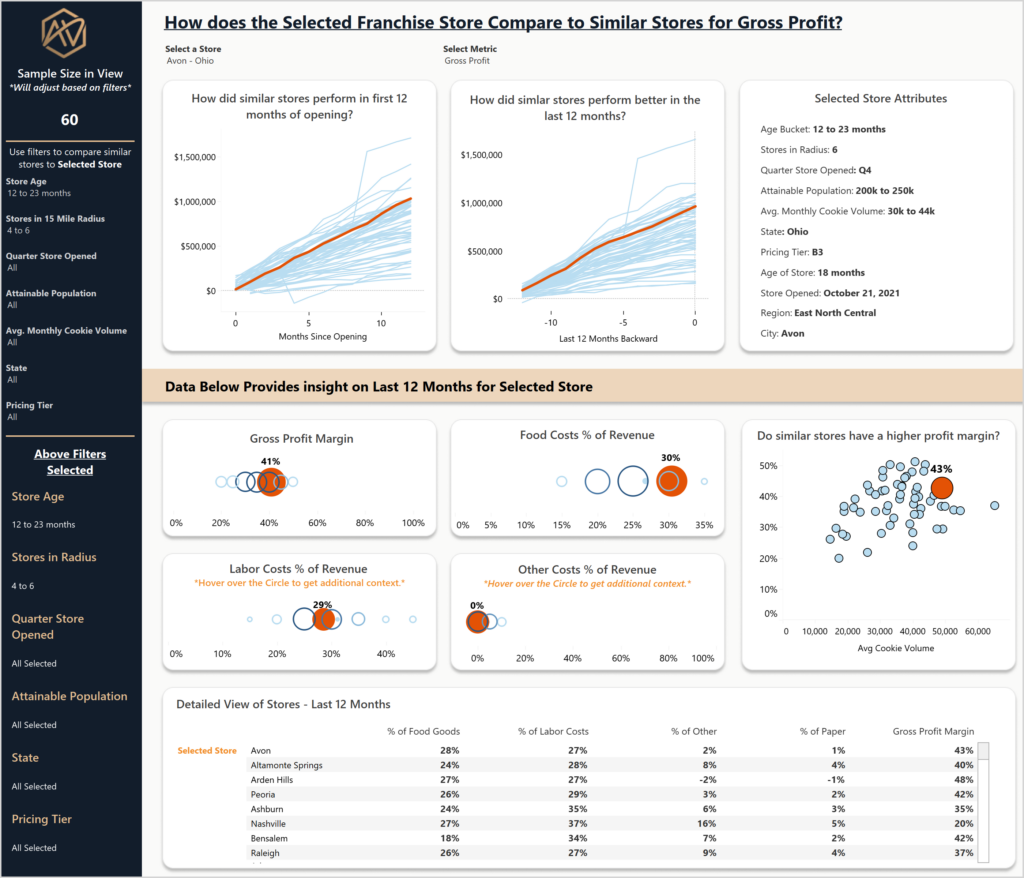
A core deliverable was a methodology to compare stores based on similar market and demographic conditions. This addressed a long-standing challenge where stores in drastically different contexts (e.g., urban vs. rural) were being inaccurately compared.
- The comparability model was approved by executive leadership and embedded into reporting workflows
- Enabled franchise support coaches to conduct more accurate performance reviews
- Achieved ~90% internal agreement across test cases and stakeholder validations
Cannibalization Analysis for Smarter Expansion
The analytics also surfaced cannibalization insights, helping the COO and CEO assess whether opening stores near each other was negatively impacting revenue performance.
- Visualizations showed performance changes before and after nearby store openings
- These insights shaped future location planning and franchise support discussions
Dual-Use Dashboard for Execs and Coaches
The solution was designed for scalability, executives could see high-level profitability trends across hundreds of locations, while success coaches could drill down into the performance of the 30–40 stores they supported.
- Built with Tableau, the tool included layered filters, benchmarks, and comparative insights
- Resulted in a 2x increase in strategic usage by field teams during routine store reviews
Operational Efficiency Gains
The consolidation of analytics and visualization into one workflow reduced friction between roles.
Dob Njinimbam directly handled both SQL querying and dashboard design, streamlining communication
The project reduced the time to deliver insights from 3–5 days to under 4 hours, thanks to unified tooling and workflow design.
Key Takeaways

Turn Store Data into Growth Decisions
Profitability dashboards helped leadership and franchise coaches quickly spot trends, compare locations, and guide smarter expansion.
Visualize Insights to Drive Action
Tableau brought the data to life, turning raw SQL and Python outputs into clear stories that shaped strategic choices.
Earn Trust Through Actionable Analytics
Delivering tools that saved time and revealed true profitability built confidence and enabled faster decision-making.
Subscribe to our latest Case Study and/or Blog Post!